|
Harvard University
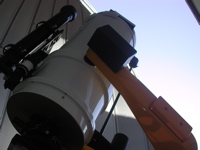
Astronomy Lab and Clay Telescope
|
|
Day Labs | Evening Labs | Cloudy Day Labs | MaximDL Help
H-R Diagram of M39 Cluster Final Report
SPU-21 Fall 2014
printer version
We will observe a bright and relatively nearby open cluster, M39, in the constellation Cygnus. By measuring the B and V band magnitudes of stars in a few of the fields around the center of this cluster, you can measure the cluster distance, approximate age, and density of its stars (how many stars per cubic volume of space).
We will do this by constructing an H-R Diagram. You will find that many stars in the images we take will not be part of the cluster but instead are either low luminosity stars (which would those be?) in the foreground or more luminous stars (are these less numerous?) in the background. Remember that a CCD image of a region of the sky is just a 2-Dimensional projection (onto your computer screen) of what is really a 3-Dimensional space. The image alone has NO depth information: you can't tell the difference between a nearby low luminous main sequence M dwarf (the most common kind out there!) vs. a more distant and thus luminous (because it has comparable apparent magnitude) M giant! Here is where the H-R diagram comes to your rescue: order appears within an otherwise scatter diagram of brightness vs. colors: the stars at a common distance (relatively speaking) “know” to organize themselves in accordance with the principles of how stars work and are built, as nuclear burning (cores) which radiate their energy from a blackbody surface at a given luminosity predicted by their mass and a temperature predicted by their radius.
Observations:
- Slew the telescope to M39 at coordinates (J2000) RA, DEC = 21:31:48, +48:26:00.
- Make some visual observations of M39
- Start by looking through the 4-inch finder scope with a wide-field eyepiece to see the cluster first-hand.
- What is your initial impression of the star colors?
- Look through the main eyepiece to see the cluster in a smaller FOV.
- Determine which way is N and E by using the hand paddle and mark the Finding Chart (pdf).
- Now we'll take some images in the B and V filters. We will take a few exposures in each filter to account for the bright stars and the fainter stars. Enter your information about the images you take in the observation table (pdf or docx).
- Try taking 2 exposures in the V filter. You should take a very short (~ 1 second )exposures to not saturate the bright stars, and another longer exposure of 10 seconds. By taking these exposures of different lengths, we can be sure to get good counts and not saturate stars of all brightness. Take 2 images for each exposure time.
- Switch to the B filter and again take exposures of different length. Try a 1 second exposure and something a bit longer, 30 seconds. Take 2 images for each exposure time.
- Now move the telescope slightly off-center of the field but overlapping by a few stars at the endge and repeat the above steps to get B and V images. We want to take images of 3-4 fields so we have plenty of stars to plot in our H-R Diagram! For each such offset, note the RA, DEC of the telescope so you can locate your field on comparison star charts.
Reductions:
We will now determine the B and V magnitudes of many of the stars in our fields. Your TF will provide you with the B and V magnitude as a calibration star in each field. We will now do the photometry, again in MaximDL, but in a slightly different way than we did for the Albireo lab. The most important thing moving forward is to LABEL your stars when doing photometry!
- We will do photometry on each field and in each filter. Open all your field 1 images in the V filter.
- Print an image of your field so you can label each star and your reference star. This is important because you will repeat these steps for the B filter and you need to make sure you get the B and V magnitudes of all stars.
- Follow the steps for doing photometry in the MaximDL section and enter your information for each field in the reductions table (pdf or docx).
- When choosing a star, reference the link for WebDA which is a very helpful website devoted to the study of clusters.
- Under Query, click on cluster chart. This will bring up an interactive chart of our cluster.
- In the right panel, click on chart form. Enter 6.5 for Square plot (and it will make a 13'x13' FOV) and 15 for V max. This will make a chart the size of our CCD image (13' x 13') and limit the stars to 15th magnitude.
- Now if you click on a star, it will bring up information (in the right panel) about the star including its magnitude and its probability. The probability is the how likely it is to be a member of this cluster. We only want to include stars of a high probability in our H-R Diagram!
- Once you have done this for all the V filter stars in field one, then repeat the above steps for the B filter.
- If you have multiple fields, then you will need to repeat the above steps for each field so you have at least 20-30 stars to plot on your H-R Diagram.
- After finishing your photometry for all fields, you will have data in multiple Excel formatted files. You TF will guide you through making a V vs. (B-V) H-R Diagram, otherwise known as a color magnitude diagram, in Excel using this template. Be sure your H-R diagram is plotted in the usual way: V mag decreasing (and so brightness or flux increasing) upwards and (B-V) increasing to right.
- IF THERE IS TIME: Your TF will also guide you through CLEA, the virtual observatory, where you virtually observe this star cluster. You will then add the data points to the HR diagram that you create. Be sure to distinguish on your HR diagram which points are from your real observed data vs. points from the CLEA software with different colors or shapes.
Analysis:
The following steps and the anlaysis handout (pdf or docx) will guide you through solving for the distance to M39, the density of stars in the cluster and the approximate age of the cluster.
- Use the Basic H-R Diagram showing MV vs. (B-V) to compare with your H-R diagram and derive the “best fit” main sequence (draw a stright line which best fits the points between B-V =0.2 - 1.0 and use the "derived" main sequence to measure the distance modulus and thus distance to M39. Estimate your error in distance from your scatter in the main sequence vs. the Basic H-R diagram. Do the following steps:
- Knowing that the Sun has a B-V of 0.6, use the Basic H-R Diagram to find the corresponding Absolute V Magnitude of the Sun, MSun.
- Now find the apparent Visual Magnitude, mM39, of M39 at a B-V of 0.6
- Find the distance to the cluster, d, using the Distance Modulus Equation, mM39 - MSun = 5log(d)-5.
- Use your derived distance and the number of main sequence stars in a single field (choose the one with most stars on or near the M-S) to estimate the density of stars in the cluster.
- Use the skinny triangle formula, the distance d to the cluster and angular width, Wa, of the CCD field (13' x 13') to derive the width of the field, Wpc, in pc units.
- Then consider the M-S stars that you counted are distributed in a box with sides given by this field, so that your N stars in a volume V = Wpc3 so that your stellar number density is nM39 = N/V.
- Compare this to the density of stars near the Sun, which is nSun = 0.1 pc-3.
- How do the total cluster star densities (no. stars/cubic pc) compare roughly with the M31 Bulge stellar densities?
- Use your own (Clay Telescope) H-R diagram to estimate the (B-V) of the Turnoff point. From the Basic H-R Diagram, then estimate the spectral type of the stars at the turnoff, and from your text the corresponding stellar mass at the Turnoff. Then use the relation (from class) for main sequence lifetime vs. mass to derive the age of a star at the Turnoff and thus cluster age. Explain in your Report why this is the age of the cluster, rather than just of stars at the Turnoff.
- How can we compare the B-V spectral types from M31 (Andromeda) and M39 (our star cluster)? What type of stars produce most of the light in M31 Bulge vs. in M39? For M39, use your B-V for the cluster turnoff.
- Given the M31 Bulge vs. M31 cluster differences, what kind of stars dominate the stars in each? HINT: for the Bulge, which clearly contains MANY more stars than the M39 cluster, think about whether giants might be the most important for total light, given what you now know about the abs. mag. or luminosity of a giant vs. a main sequence star of the same color... and so how many main sequence stars would you need to make the "brightness" of one giant... But for giants to dominate (which they do), think about what we learned about how long a star is on the giant branch vs. age of M31 (which you can assume 10 Gy).