|
Harvard University
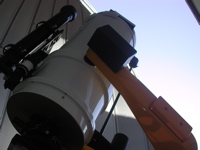
Astronomy Lab and Clay Telescope
|
|
Day Labs | Evening Labs | Cloudy Day Labs | MaximDL Help
Measurement of the Sun’s Rotational Period using Sunspots
DL Obs 3
SPU-21 Fall 2015
printer version
The motion of the Sun in the sky tells us something about the rotation of the Earth, and the Earth's orbit around the Sun. An important motion of the Sun itself is its rotation about its own axis. This can be measured by using sunspots as tracers of that rotation, as Galileo first did in 1612.
Why is rotation period important? For one thing, it is believed that the solar rotation ultimately causes the creation of sunspots themselves. Other stars (with similar, or cooler, temperature) that rotate more rapidly than the Sun can have more and bigger spots. A primary goal for this lab is to determine the period of rotation of the Sun - that is, how many days it takes to rotate once around its own axis. A second goal of our observations is to determine the direction of the Sun's rotation.
If we take data over a period of a few days to a few weeks, we can determine how much the sunspots move and determine its apparent motion across the face of the Sun. If we make the assumption that the spots are carried across the Sun by rotation, we can then infer the period with which the Sun rotates. And, if we know which way the Sun is in place of the Earth's orbit, we can tell the direction of rotation.
What you'll need:
- 2 or more students
- A white sheet of paper
- Colored markers to mark sunspots
- Neutral density filter
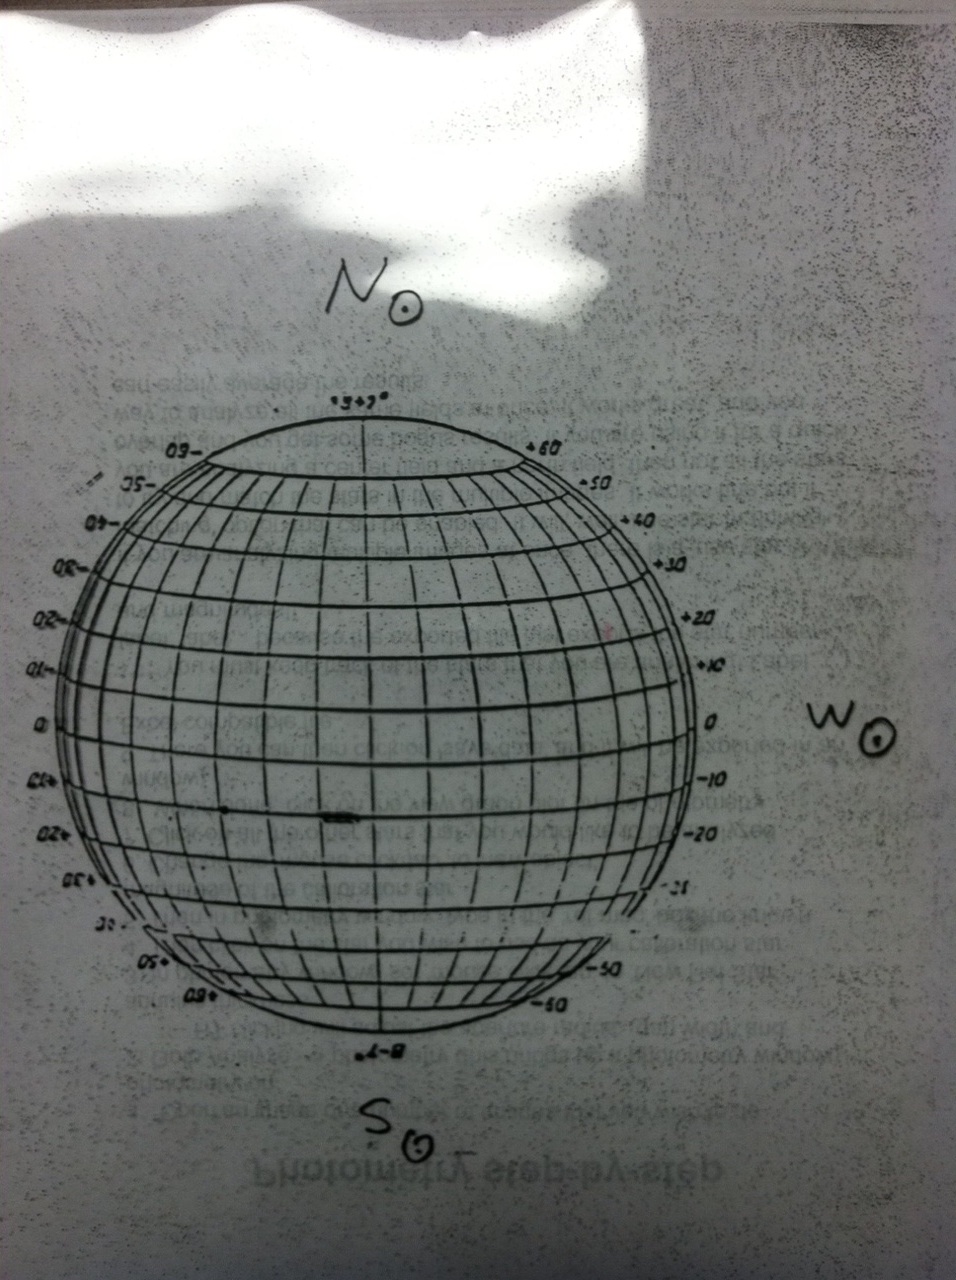
- Transparent grid of the Sun
Procedure:
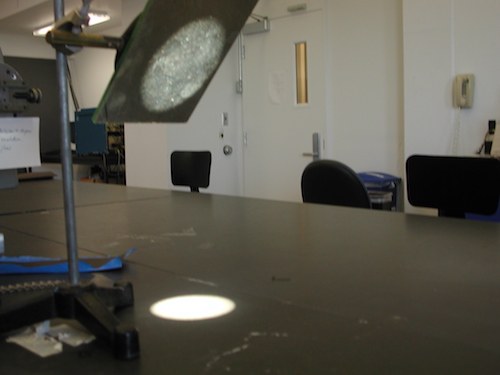
- First, set up the heliostat so that the projected image of the sun is on the table (you will need the table mirror setup in front of the spectrgraph slit).
- Place a white sheet of paper with the "empty" circle plotted (we will have a stack of these for you; the circle matches the diameter of the solar image on the table) so that the Sun's image fills the circle and adjust the focus of the projected image by moving the table mirror (starting at the slit) away from the slit. Find the spot where the image looks most crisp at the edges of the Sun.
- Once in focus place the neutral density filter over the projected image of the sun so you can see the sunspots easier.
- When you think you located a sunspot, check to mark sure its a real spot and not just dust or a mark on the table mirror. To do this, have one person use the motor controls in the lab to move the image E or W. If you see the sunspot stay in the same spot on the Sun's disk as the image moves, then it's real!
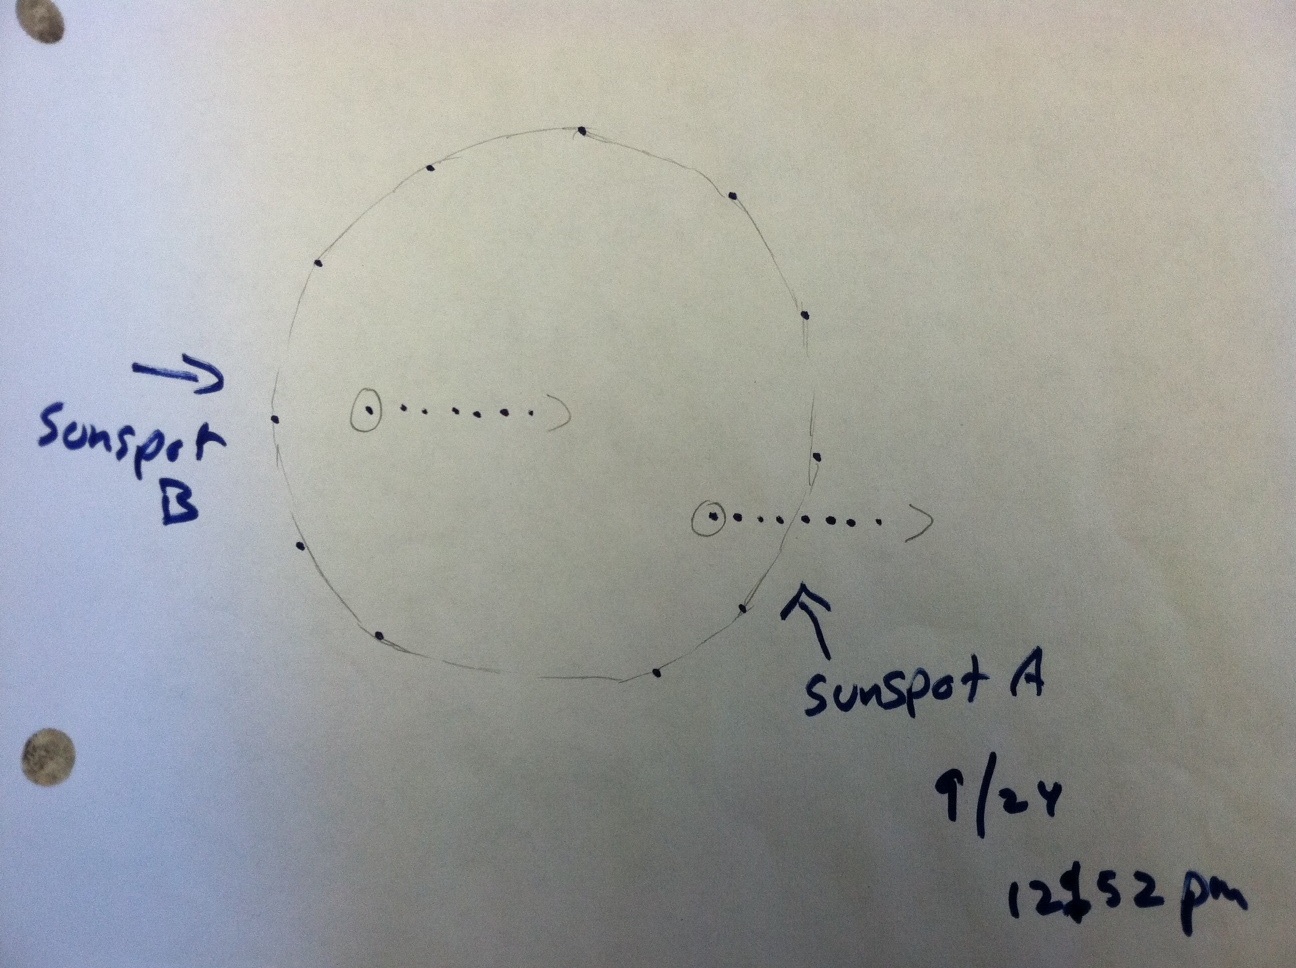
- Now that you have located one (or more!) sunspots you can mark the edge of the sun in at least three spots on the white paper. You also want to mark the center of your sunspot and then circle it. If there is more than one mark each sunspot with a different color. Make sure not to move the paper!
- Because there are so many mirrors that the Sun is being reflected off of to get to our projected image on the table, we cannot be sure that the direction E-W is necessarily where you think it would be, so we need to check. Sunspots should move on lines of solar latitude so by marking the direction the spot is moving we can determine E-W on the Sun. To do this, we will have one person go use the heliostat motor controls to move the projected image to the E. As the image of the Sun begins to move, another person needs to BE READY to start marking sunspots. As the sunspot(s) begin to move begin marking the direction the spot is moving by continuing to mark the center of the spot as the Sun moves. DO NOT move the paper! Once you can tell the direction the sunspot is moving (from having made a few marks) you can stop marking and halt the motors.
- Also, make sure to record the date and time on the sheet. You will repeat this over a period of several days to weeks but make sure you are marking the SAME spot(s) each day! Each day you start with a new blank circle template. When we are done collecting data, we will overlay all the data on the transparent grid to see how the sunspots moved!
- NOTE: If there are no sunspots or it is cloudy and you are unable to get enough data, you will have to use archival data. There are archival sunspot movies on each computer desktop. Open the movie and resize the window to the same size as the transparency grid of the Sun. Find a sunspot that is aligned on a line of latitude. You will then be able to follow the analysis below using the time from the time stamp on the movie.
Analysis:
- The first step is to overlay (one-by-one) each day's data on the transparency of the grid of the Sun. Make sure to note the direction the sunspot is moving and rotate your marked paper to line it up on a line of latitude. Mark the sunspot (that was circled) with a marker (labeled by date and time) on the transparent grid.
- Once all the data is marked on the transparency, you can then note the direction the sunspot is moving and begin to calculate the rotational period.
- Begin by making a plot on graph paper, plotting longitude vertically, (on a scale from -90 degrees (i.e. 90 degrees E) though 0 (central meridian) to +90 degrees (90 degrees W). The horizontal axis should be time in units of days. For example, 12:30pm would be 12.5/24 of a day. Note that the longitude lines are in 10 degree increments. If you made good measurements, the points for each spot should lie roughly on a straight line. Draw the closest straight line through the points.
- The slope, S, of the line (units: degrees/day) gives an estimate for the period., which is then just P = 360/S. The slope is defined by S=L2-L1/T2-T1, where L2 and L1 are points of longitude and T2 and T1 are the corresponding times associated with those points of longitude.
- If there is more than one spot, carry out the above reductions for all spots. Derive a period estimate for each spot, and then average them to get the best estimate as well as uncertainty.