|
Harvard University
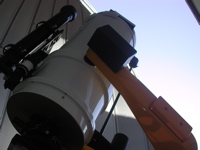
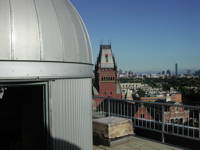
Astronomy Lab and Clay Telescope
|
|
Day Labs | Evening Labs | Cloudy Day Labs | MaximDL/CCDOps Help
Getting a Wavelength Solution
There is a great software program called SBIG Spectral Calibration (Spectra) that allows you to input your object spectrum and calibration spectrum to determine a wavelength solution (i.e. what wavelength corresponds to what pixel). First, we must get our spectra in the right format for the Spectra software.
Extract and Crop Spectra in MaximDL
- Open object spectrum and correpsonding calibration spectrum in MaximDL
- Open a graph window to extract the spectrum and view plot
- On menu bar, View --> Graph plot
- Make sure the pulldown box (bottom left) in the graph window says horizontal box
- Drag your cursor from left to right, top to bottom of a small region of the spectrum that has no obvious defects [BE SURE to get ALL x-pixels from 0-764]
- Crop spectrum and save to correct format
- On menu bar, Edit --> Crop
- Set current image width = 765 and new image width = 765
- Set new image height = 20
- Click Update
- Click File save as SBIG type 3 images
Determine Wavelength Solution in SBIG Spectral Calibration Program (Spectra)
Under Object Spectrum click Load Spectra and choose your cropped object spectra
Under Calibration Spectra click Load Cal and choose your cropped calibration spectra
Click Graph Cal, which will now allow you to choose your slide the bar over the calbration line
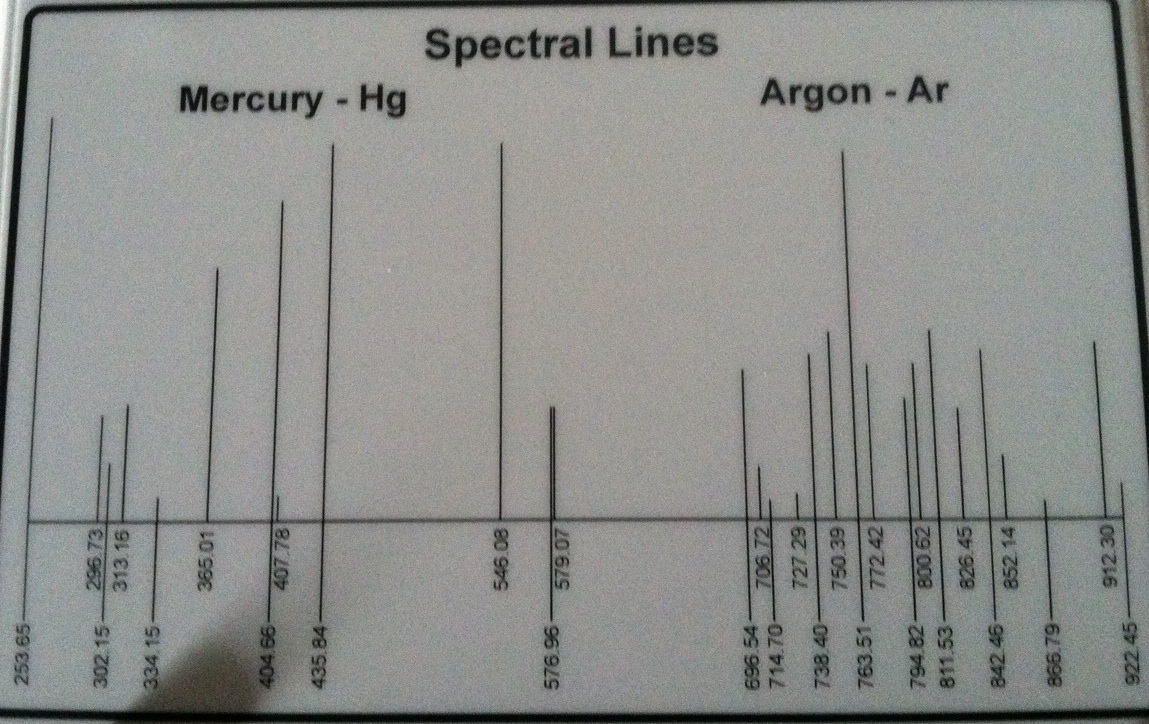
Using the image below as a reference, choose a line from below and slide the bar to center over the correpsonding line in Spectra
Adjust Select width of region for centroid calibration (pixels) to appropriate width for the line
Choose the line wavelength from Idenitify spectral line (Angrstroms)
Then click Mark Line 1
Repeat this procedure for a second line and then click Mark Line 2. You should now have a wavelength solution!
Now click Graph Spectra. Slide your cursor over a feature in the object spectrum and click Calculate Line Wavelength. This will give you the wavelength of that feature!
You can also Print Graph or Write text file