|
Harvard University
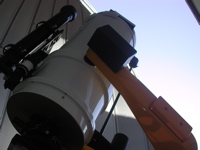
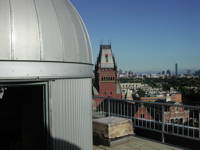
Astronomy Lab and Clay Telescope
|
|
Day Labs | Evening Labs | Cloudy Day Labs | MaximDL Help
CLEA H-R Diagram of Star Cluster
SPU-21 Fall 2014
printer version
CLEA (Contemporary Laboratory Experiences in Astronomy), developed by Gettysburg College, uses digital images to create online laboratory exercises. This cloudy day exercise is a compliment to our final evening lab which measure the B and V values of stars in the chosen star cluster.
Procedure:
- Open CLEA VIREO from the Desktop on any of the PCs in the Astronomy Lab
- File --> login
- Enter your name for Student #
- Enter CD3 for Lab Table #
- File --> Run Exercise HR Diagram of Star Clusters
- Click Telescope - Optical - Access 0.4m (you can request access for the larger telescope but it will take time to process)
- Click Open Dome
- Turn Telescope Control Panel "on"
- Turn on Tracking
- From the menu bar - slew to coordinates RA, DEC of your cluster
- On the Telescope Control Panel change the View to Telescope, not Finder
- Now, on the Instrument box make sure it is set on Photometer and then click access
- First, we want to take a Sky reading in both B and V filters
- Second, we will take B and V integrations of at least 10-20 (or more!) of the stars in cluster
- Be sure to label!!!
- Using the Telescope Control Panel, you can center the red circle on each star before taking reading.
- After each measurement, (in the Photometer Control Window) click File > data > record/review. This will save your data to a file.
- When you are finished measuring stars, close the Photometry window and Telescope Control Window
- To access your data, in the Main Control window, click Tools > Results Editor > Observational Results > Display/Print/Save Text
Import your data into Excel and add these supplementary observations to your real observations when creating your HR Diagram!