Harvard University
Astronomy Lab and Clay Telescope
|
Harvard UniversityAstronomy Lab and Clay Telescope |
|
Day Labs | Evening Labs | Cloudy Day Labs | MaximDL Help
Evelab Final Report
SPU-21 Fall 2015
Your Final Report for Evelab is meant for you to summarize your Observations and data Reductions for EL-Obs 3 (M39 H-R diagram) and EL-Obs 4 (M57, the Ring Nebula, and M31, the Andromeda galaxy) and to carry out some simple analysis of all 3 objects to learn some basic properties of these 3 different "extended" objects: a star cluster, a Planetary Nebula, and a galaxy. Since all 3 objects are photometry projects, your Introduction section of the paper should briefly refer to EL-Obs 2 and what you did and learned about Albireo. You will derive some basic characteristics of each of the 3 objects in your Analysis section, and in your Discussion section you can inter-compare them: how they each provide key insights into properties of stars, stellar evolution, and the vast conglomeration of stars that form a galaxy. You should summarize your observations, data reduction and analysis for each of these 3 objects ias the first 3 sections (following a general Introduction section) of your Report and then in a Discussion section inter-compare them. Following are the principal data reduction and data analysis tasks to carry out for each object:
M39
Data reduction:
In EL-Obs 3, you have already prodcued your H-R diagram which is the results of your observations being reduced to photometry. Use your "final" H-R diagram plot to draw the cluster main-sequence on your plot of V vs. (B-V) for all teh stars measured and incorporating any comments we made on your EL-Obs 3 Report. You H-R diagram will include stars from ALL the fields combined. Then circle or color red the stars on the plot from only the central field (i.e. not NW, SE, etc.) that are on or near the m-s turnoff and count the number of these central field stars, Nstars, (NOTE: since all data & fields were combined, TFs will send to everyone the B and V mad values for all stars measured in just the central field, including any that are in the central field but might have been actually measured in anothr field due to field overlaps.)
Data analysis:
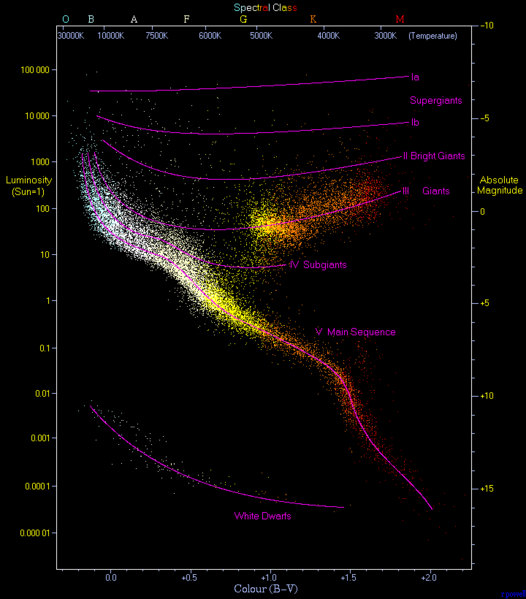
First, derive the distance (in pc) to M39 by plotting a line for the main sequence (hereafter m-s) for absolute magnitude MV vs. (B-V) using the figure B-V vs. MV HR diagram. Pick TWO values of your measured M39 m-s line for V vs. (B-V) at (B-V) values of 0.4 and 0.8. Your observed m-s line should be roughly parallel to the m-s line for MV vs. (B-V) from the reference figure over this range of the m-s. Take the difference, mV - MV, at 2 points along the line (at B-V values 0.4 and 0.8) and average those two differences for your best estimate of mV - MV, the distance modulus, and derive d in pc. Your estimated error in mV - MV could be the difference of either or both of your "end points" from the average value of mV - MV you derived, and from the hight vs. low values of mV - MV (on either side of your average) you can derive the corresponding distance to give your error in the cluster distance.
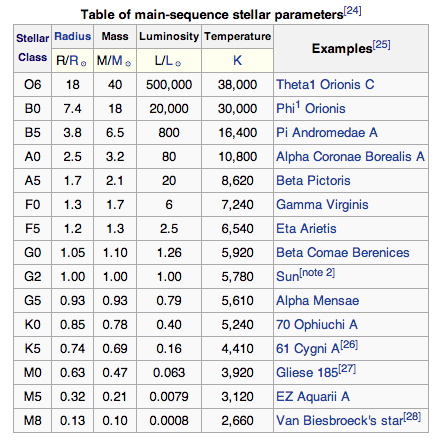
Second, derive the approximate age of the M39 cluster. Mark the turnoff point on your observed m-s where the stars begin to fall above (brighter than) the m-s line you have drawn for stars fainter and redder. Note the (B-V) color of this turnoff and compare with the template H-R diagra figure B-V vs. MV HR diagram. What is the Spectral Type for your estimated (B-V) at the Turnoff? Then using the table M-S mass vs SpType Table, estimate the mass of stars at the turnoff point. You could estimate the uncertainty on this by estimating the uncertainty of where you marked the B-V color and from that comparing the max vs. min mass estimates. Finally, for your estimated turnoff mass, derive the age of M39, using our equation for m-s lifetime, Tm-s 1010/(M/Msun)-2.5 years. Once again, from your approximate uncertainty on the turnoff mass, you can estimate a rough uncertainty on the cluster age.
Third, use your derived distance d(pc) and the skinny triangle formula to derive the width, W(pc) of the cluster central field, give the angular size of the field of view of our CCD camera which is A(arcmin) = 13 arcmin. Convert this to radians using conversion 1 arcmin = 1/60 degree and 1 degree = π/180 radians = 3.14/180 radians. Then derive the density of stars in a box in M39 with side W(pc) in the central field: Density(stars) = Nstars/W(pc)3 where Nstars is the number of stars on or near the m-s and turnoff in your H-R diagram for stars in the central field that you should have circled and counted (see above). How does the central M39 stellar density, in units stars/pc3, compare with the density of stars near the Sun, which is about 0.1 stars/pc3?
M57 (Ring Nebula)
Data reduction:
In your EL4-Obs Report, you (should) have derived B and V magnitudes (ideally each as the average of 2 measurements) for the central 4 pixel radius surrounding the central white dwarf (WD) as well as B and V magnitudes for the Ring, between 12 pixel radius and either 17 or 20 pixel radius.
Data analysis:
First, given the distance to the Ring Nebula of d=700pc, derive the absolute magnitude in the V band, MV, for the WD and for the Ring shell. What are the luminosities in solar units for each source in the V band? (use the absolute magnitude definition: MV = -2.5logLV+ const to derive LV(WD or Ring)/LV(Sun) = 10-0.4(MV(WD or Ring) - MV(Sun)), where MV(Sun) = +4.7.
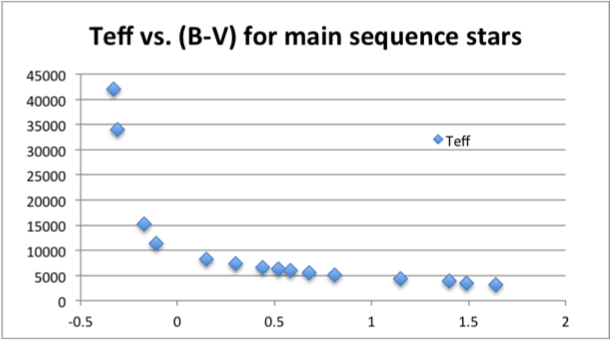
Second, derive the approximate temperature of the WD and the Ring, assuming both are black bodies, from the B-V mag and the scale of B-V color vs. temperature as plotted on the H-R diagram figure B-V vs. MV HR diagram or use the plot from Lecture, namely the figure Temp vs. B-V m-s stars. Note the WD B-V is "contaminated" by the nebula (in V) so temperature will likely be too low.
Third, check your estimated temperature for the Ring Nebula against what its radius and luminosity would say it should be (in solar units) if the Ring is a black body. You need to first derive the Ring radius in km to compare it with the Sun (since your luminosity is also in solar units). For that you need to know 1 pixel = 1.56 arcsec and convert to radians and use the Skinny Triangle formula for the M57 distance given above. Use the Ring radius as the "Outer shell" radius of 17 or 20 pixels as listed above. What about the WD temperature? It is a (relatively) massive WD, with mass M ~ 1.2 Msun and radius R ~ 0.007 Rsun. For this radius, and your measured MV for the WD, what should its Black Body temperature be?
M31 (Andromeda)
Data reduction:
Once again, use your Reductions to magnitudes from your EL-Obs 4 Report and you Table of B and V magnitudes for the 4 apertures of radii 16, 32, 48, and 96 pixels.
Data analysis:
First, given the distance to M31 of 780 kpc, derive the absolute magnitude of the enclosed light from M31 in the V band in each of the 4 apertures. These absolute magnitudes, MV, should be derived from your average observed V magnitude (if you indeed had 2 measurements in each aperture).
Second, derive the B-V color of the 4 regions of the Bulge of M31 and for each, estimate the spectral type by using the conversion from B-V spectra type given in the H-R diagram plot B-V vs. MV HR diagram. Estimate the sub-type (e.g. G2 vs. G5) by interpolating on the scale across the top of this diagram.
Third, derive the approximate total mass in each of the 4 aperture regions by using your derived absolute magnitude MV and the corresponding value for the Sun (MV = 4.7). The difference in these absolute magnitudes is of course the ratio of the luminosities, just as you did above for M57. The ratio of the luminosities is then teh ratio of the masses (assuming a fixed mass/luminosity ratio = 1 in solar units). From your 4 mass-enclosed numbers, make two plots: 1) Mass enclosed(solar masses) vs. Radius(pc) and 2) mass in each annulus (the central 12 pixel radius aperture is still enclosed mass) derived by subtracting the total luminosityor mass in aperture 1 from aperture 2; aperture 2 from aperture 3; etc. For BOTH plots, try using logarithmic scales, since the values for mass will range over more than a factor of 10. So plot on y-axis log(mass) and on x-axis log(radius) values. [you can also make plots without log scales for comparision, if you like]. For plot 2, on log scales, what is the approximate slope of a rough fit line through your 4 points? Summarize your results for both plots with two Tables showing values for each aperture radius. The Tables should have the following column headings:
Radius(pix) | Radius(pc) | B mag | V mag | (B-V) | MV | L/Lsun | M/Msun
The final 2 columns in each row should give the enclosed or annulus luminosity and mass for that aperture in solar units using the same formalism as above for M57, and see below for deriving the enclosed mass for each aperture (assuming a constant M/L ratio).
Fourth, and finally, what kind of stars are responsible for most of the light in each aperture? Use the figure B-V vs. MV HR diagram to convert from B-V to spectral type.
Discussion Section: Combined for all 3 "Nebulae" (at the end of the Report)
Here you can put your own words down to describe your understanding of these 3 very different, but related, "nebulae". Only on of them (the Ring) is a true nebula, of course, but all 3 are Messier Catalog objects which means they are extended and not "just" single stars. Here are a few items you can discuss in this ~1.5 page sections of your Report:
Format of the Evelab Final Report
Introduction: Motivation (~0.5 page) to measure these 3 very different "extended" objects? How did they all "build" on what you did in EL-Obs 2?
Observations: Describe (briefly; 0.5-1 page) the observations you did for your ObsReports 3-4 and your observations and your estimate of measurement uncertainties - e.g., your approximate uncertainties in your V and B magnitudes (rough estimate) from scatter (if you have more than one measurement) or from how well you centered on M57 or M31
Data reductions: Brief summary (~0.5-1 page) of how you "reduced" your measured observations and derived your measurement uncertainties. Estimate your uncertainty in HOW you fit the m-s in M39 and thus its distance. What is your rough estimate of the uncertainty in your distance estimate (in pc units) for M39 and the corresponding uncertainty in stellar density? What is your estimated uncertainty in the mass within the 4 regions of M31?
Data analysis:In this section (~4-5 pages; you need at least a page for each of your 3 objects), you describe how you used your measurements to derive the values for the items listed above. As noted below, please show your work in the Appendix.
Discussion (1-2 pages): Here you can have some fun: in your own words, interpret your data. What do the numbers of bright vs. faint stars on the m-s tell us about hte distribution of stellar mass in M39? How do M39 and M57 show stellar evolution? What do the V magnitudes and derived MV and masses in the 12-96 pixel apertures tell you about how luminosity and mass per unit area in each annulus rise toward the center?
Figures and references: Include any figures (again, hand-drawn sketches are fine!), with Figure numbers pointed to in the text, and references given (and listed at the end of the paper) for any outside references (e.g. Wikipedia) you might consult. Please include your "worksheets" showing derivations as an Appendix at the end of the Report.